
A Series of Fibs
By: John Vereen
For
my bonus exploration, I will explore the Fibonacci sequence using Excel. What
exactly is the Fibonacci sequence? Well, the Fibonacci sequence in a sequence
of numbers of the form an = an-1 + an-2. In other words, each successive number of the sequence is the sum of the
previous two numbers in the sequence. The Fibonacci sequence starts with the
numbers 0 and 1.
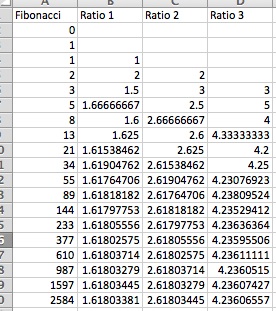
Using
Microsoft Excel, we have created four specific columns
Column 1 = Fibonacci sequence
Column 2 = ratio of consecutive terms = 1.618
Column 3 = ratio of every other term = 2.618
Column 4 = ratio of every third term = 4.236
We
notice a recurring theme with the ratio columns of the Fibonacci sequence. Whether
it’s the ratio between consecutive numbers, every other number, or every third
number, there is always a limit to what the ratio will be. Each ratio column
starts out unstable and then levels out to a set ratio.
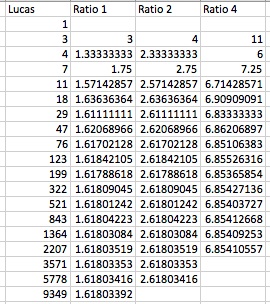
In
the image above, we explored the Lucas sequence. This sequence is similar to the
Fibonacci sequence, except we start with 1 and 3 instead of 0 and 1. The
columns are as follows:
Column 1 = Lucas sequence
Column 2 = ratio of consecutive terms = 1.618
Column 3 = ratio of every other term = 2.618
Column 4 = ratio of every third term = 4.236
It is fascinating that the columns for each ratio of the
consecutive terms, every other term, and every third term are the same for both
sequences despite the different initial values! Also, each initial ratio of
1.618 is equivalent to the golden ratio, which is a famous phenomenon of
mathematics.